The official estimated attendance of March for Science Indianapolis is 10,000 people.
How did we come to this conclusion?
What do we know?
First, we took a few pictures at the start of our program:
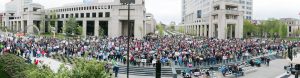
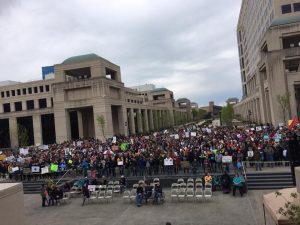
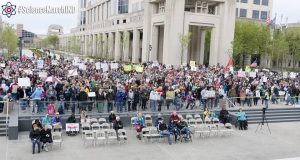
These images shows that from pillar to pillar, behind the accessibility seating area, there was a constant density of attendees with thinning spillover on each side.
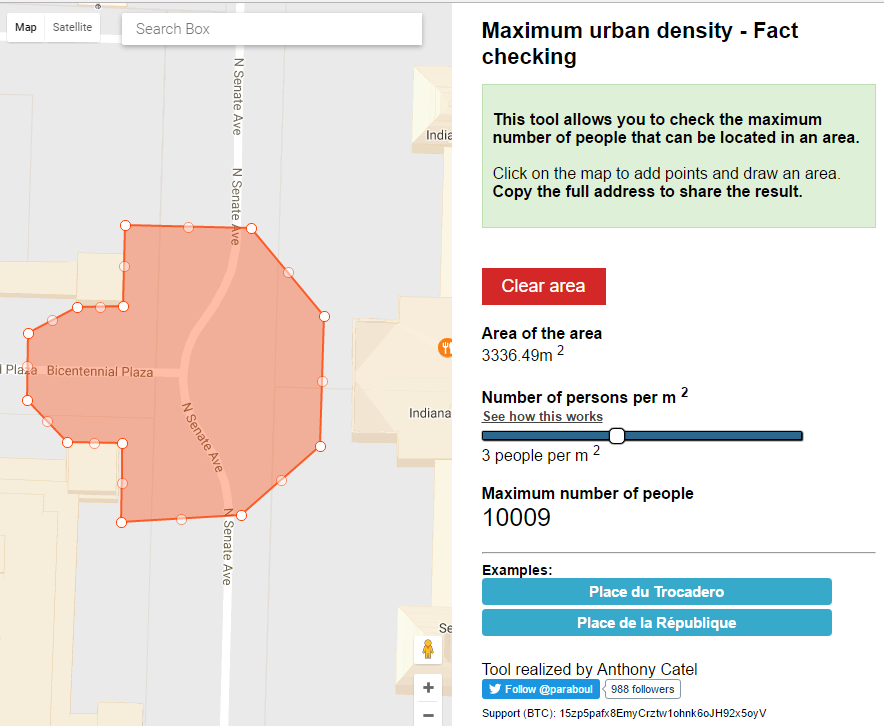
We can approximately model this area on google maps, using the tool MapChecking, and the image above.
This provides an approximate square footage for the image above.
What are our assumptions?
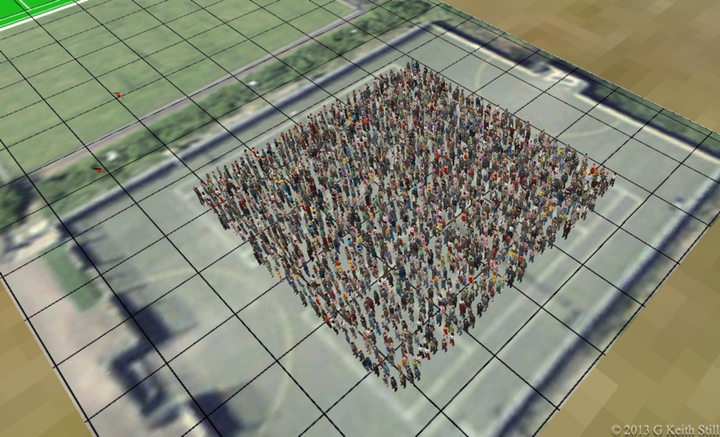
Next we estimate the crowd density using using Prof. Dr. G. Keith Still’s static crowd density visuals.
Minimum Estimated Crowd
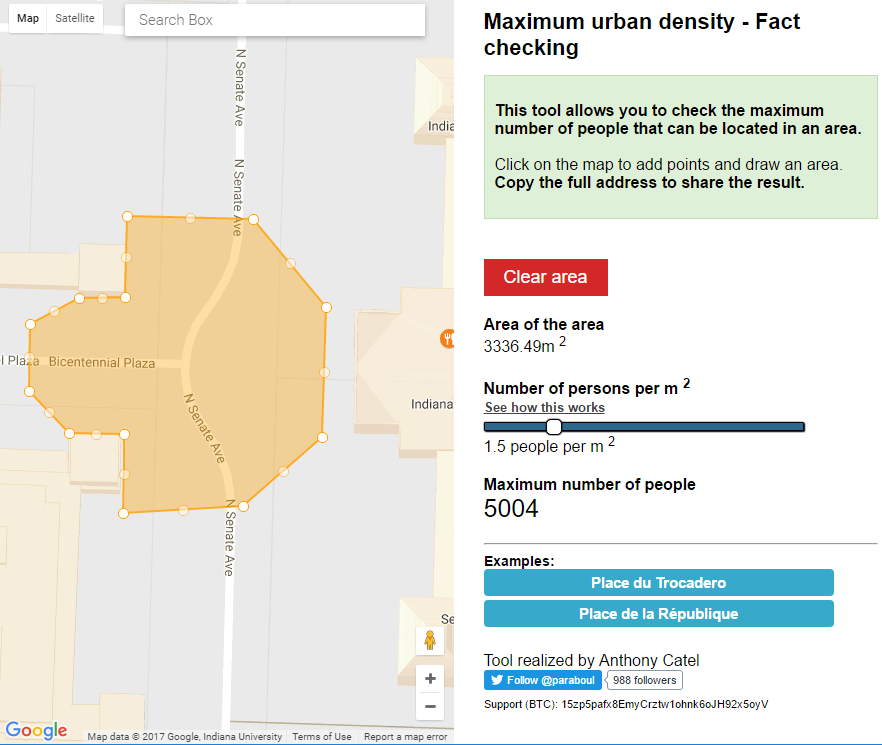
Below is the visual for 1.5 people per square meter.
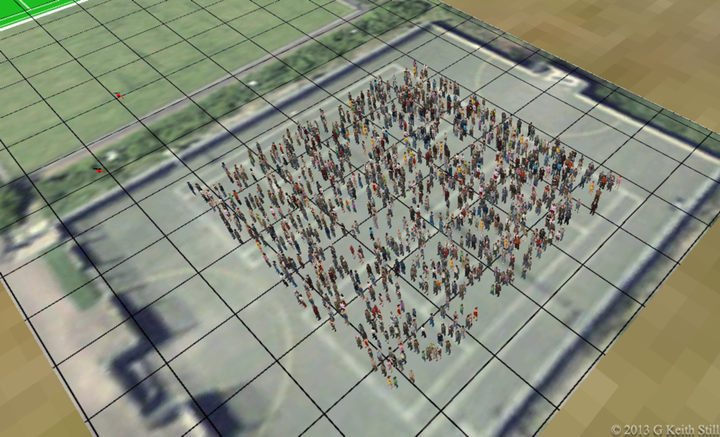
Using this as our minimum estimate, we have an estimated pictured attendance of 5,004 people.
Middle Estimated Crowds
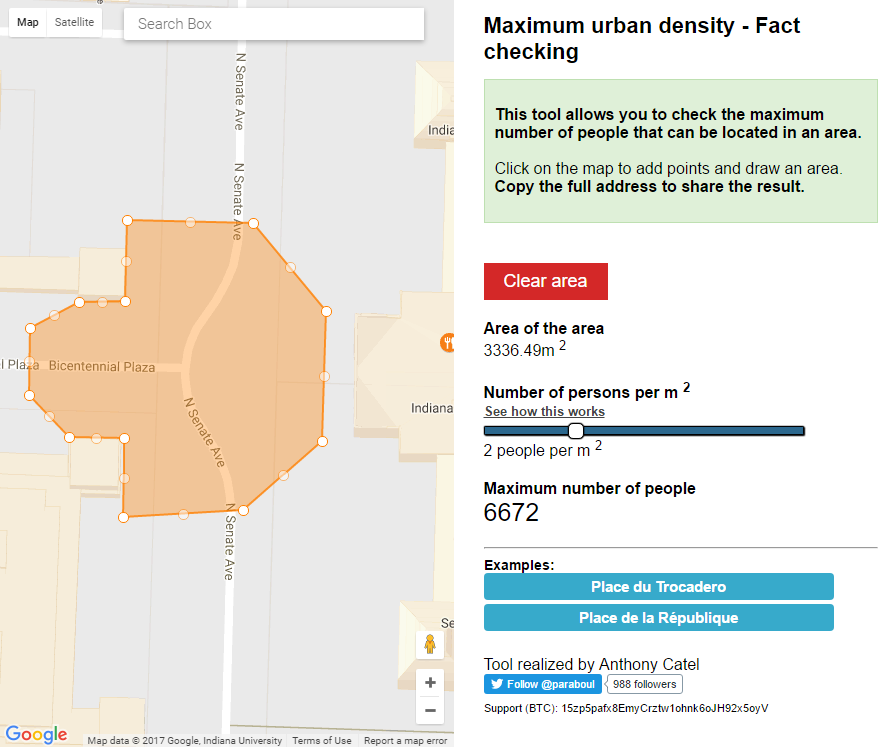
Below is the visual for 2 people per square meter.

Using this as first mid estimate, we have an estimated pictured attendance of 6,672 people.
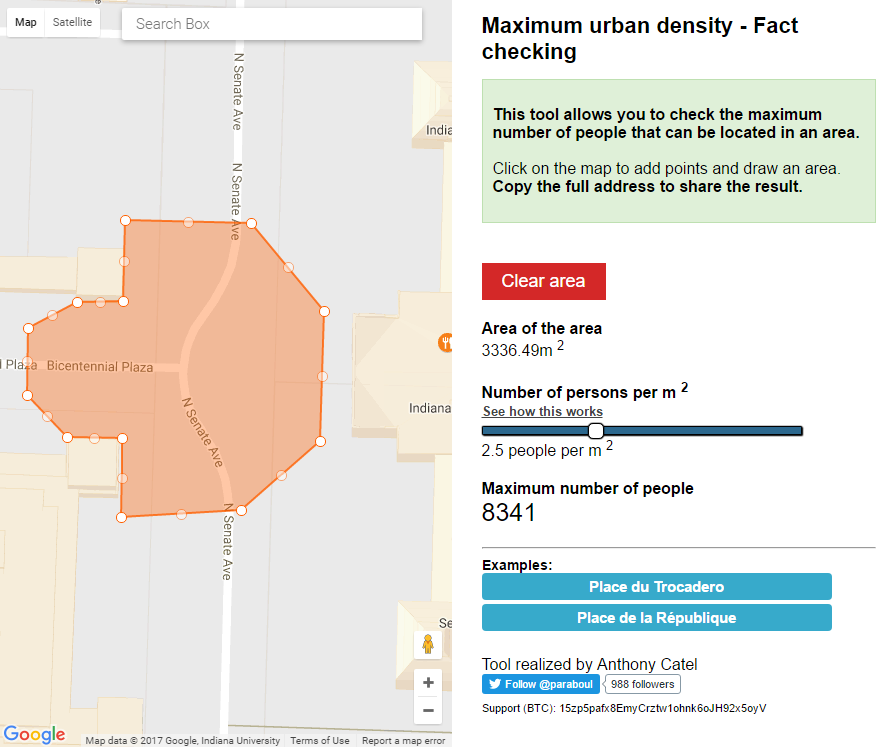
Below is the visual for 2.5 people per square meter.
Using this as our second mid estimate, we have an estimated pictured attendance of 8,341 people.
Maximum Estimated Crowd
Below is the visual for 3 people per square meter.
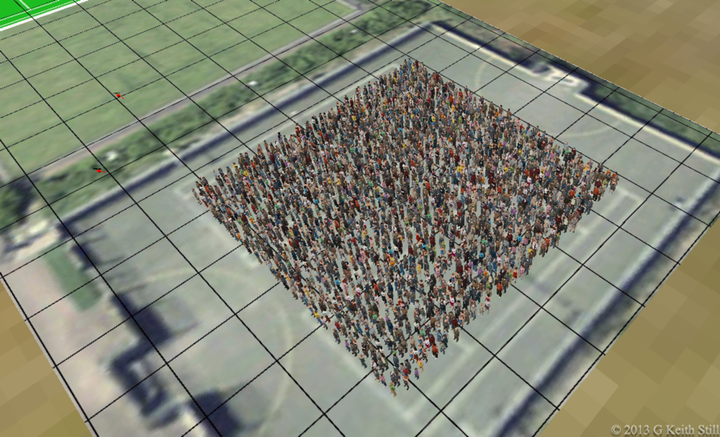
Using this as our second mid estimate, we have an estimated pictured attendance of 10,009 people.
What is our conclusion?
Looking at the crowd density for 1.5 people per square meter, it looks sparse for our images above.
Looking at the crowd density for 3 people per square meter, it looks ambitious for our images above.
So we are forced to make a judgment call between 2 and 2.5 people per square meter. We are not experts in the field of crowd estimation, so we will simply split the difference which gives us an estimated pictured attendance of 7,506.5 people.
Given that these images do not take into account any of the peripheral crowd and that the images were taken at the start of the program and do not represent anyone who came late, we feel confident that a baseline estimate of 7,500 people is a safe conservative number with minimal room for debate.
If we make an educated guess at the number of attendees not pictured, and of the crowd growth throughout the program, we think there is a compelling argument to be made for an estimated attendance of 10,000 people.
Therefore we make the claim that an estimated 10,000 people attended March for Science Indianapolis on April 22nd 2017.
We welcome any feedback and all debate on our methodology and assumptions.